

Looker Studio
Looker Studio / Data Studio Agency
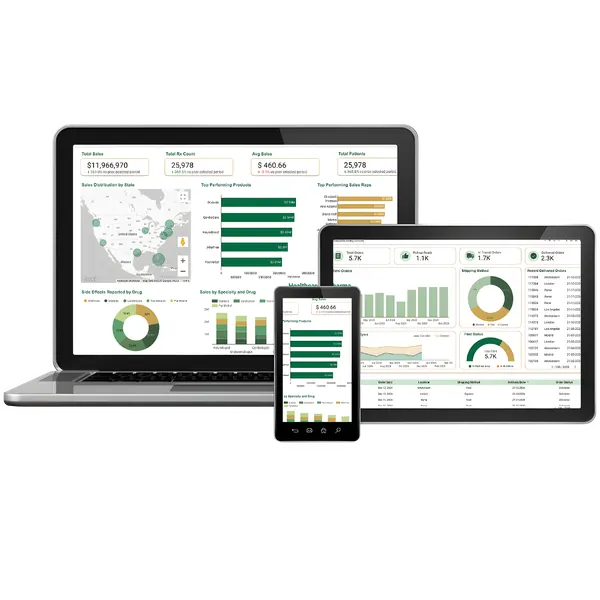
Dashboards built in Looker Studio, formerly Google Data Studio, for teams that want everyone to see the numbers.
01
Looker Studio, still searched for as Google Data Studio
Google renamed Data Studio to Looker Studio in October 2022. Same product, same free tier, same reports; a different name above the door. If you are looking for a Data Studio agency, you are in the right place.
We build Looker Studio dashboards for teams who have outgrown a spreadsheet but do not want a licence bill for every viewer. The numbers usually exist already; they live in five places, and nobody trusts the version in the deck. We work remotely with clients in India, the UK, Europe, North America and Australia, and every build runs against your data, not a demo set.
02
What we build in Looker Studio
Marketing performance reporting
Spend, pipeline and return in one view across Google Ads, Meta, LinkedIn and organic. Channel comparison that survives a budget conversation.
- Cost per acquisition by channel and campaign
- Attribution windows you can change without a rebuild
- Month-on-month and year-on-year in the same chart
Executive and KPI dashboards
The eight to twelve numbers leadership actually asks about, on one page, refreshed without anyone exporting anything.
- A single page a board can read in two minutes
- Drill-through to the detail behind each number
- Targets and variance, not just actuals
Ecommerce and revenue reporting
Orders, margin, returns and customer cohorts joined to the ad spend that produced them, so profitability is visible per product and per channel.
- Shopify, WooCommerce and Amazon Seller data
- Contribution margin after fees and shipping
- Repeat rate and cohort retention
White-label reporting for agencies
One template, many clients, your branding. Built so adding the next client is a data source change rather than a new build.
- Parameterised templates across a client roster
- Client-safe sharing with no Google account required
- Scheduled PDF delivery on your cadence
BigQuery-backed dashboards
When the data outgrows connectors and extracts, we model it in BigQuery first so the dashboard stays fast and the numbers stay reconcilable.
- Scheduled queries and materialised tables
- Row-level access by client, region or team
- Costs kept predictable with partitioning
Rescuing inherited reports
Someone built it, they left, and now it breaks quietly. We take over legacy Data Studio reports, find what is wrong and make them maintainable.
- Broken blends and silently failing connectors
- Duplicated metrics that disagree with each other
- Documentation, so the next person is not stuck
03
Looker Studio dashboards we have built
Retail and ecommerce performance
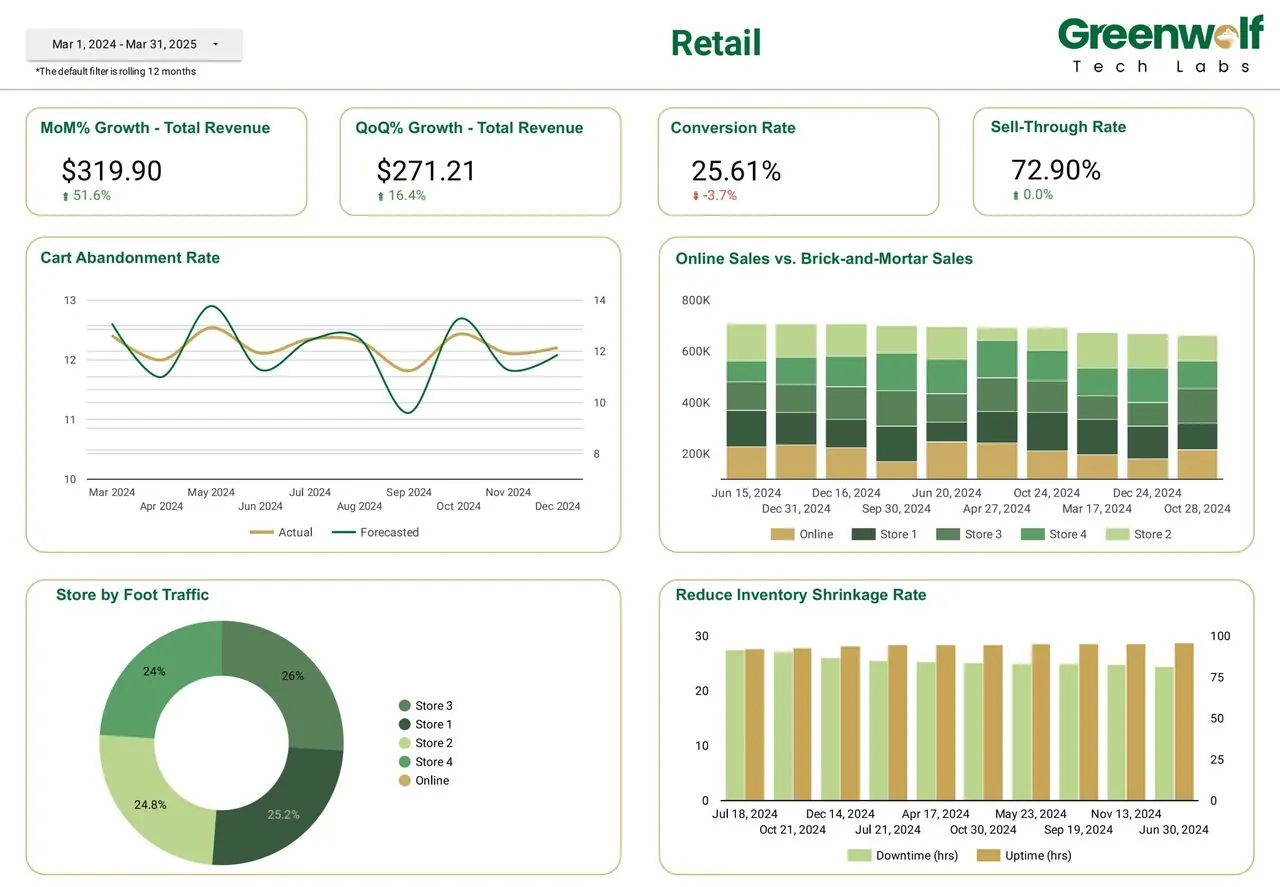
Online and in-store sales on one page, with the conversion and sell-through numbers a trading meeting actually argues about. Ad platforms report the revenue they think they caused; this report reconciles it to orders.
- Online against brick-and-mortar revenue, store by store
- Cart abandonment tracked against forecast
- Foot traffic and inventory shrinkage beside sales
Brand performance for a pharma team
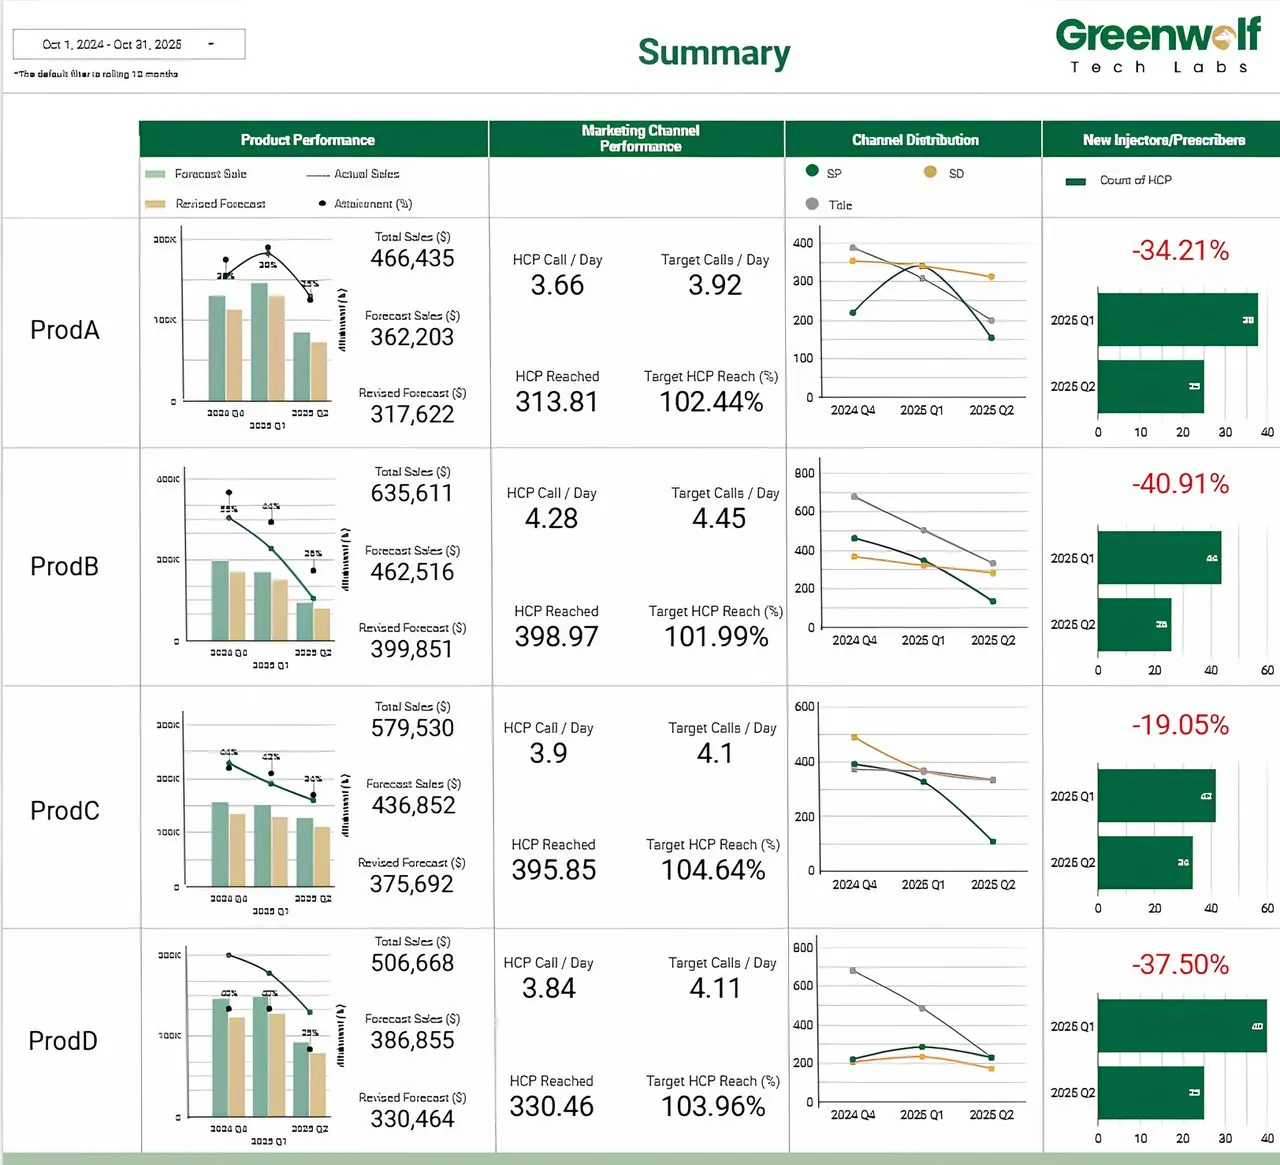
Four products, forecast against actual, joined to field activity and channel distribution, so a brand lead can see which product is behind plan and whether the field or the channel explains it.
- Actual, forecast and revised forecast per product
- HCP calls per day and reach against target
- New prescribers by quarter, with the change called out
Row-level access by team and territory, with every metric traceable to its definition.
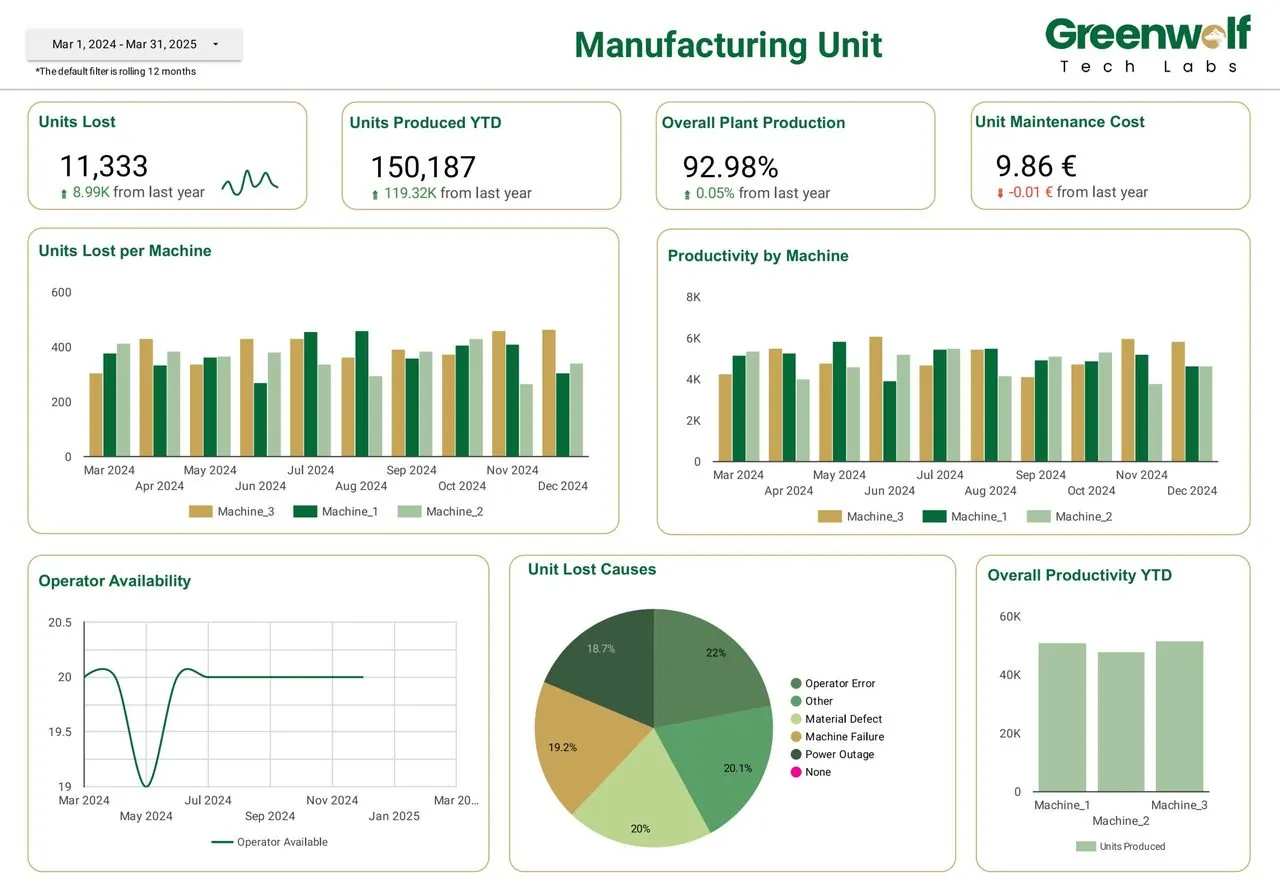
Manufacturing output and downtime
Production, quality and downtime from systems that were never designed to be read together, put on one page for the people running the week.
- Throughput against plan by line
- Loss and downtime reasons, ranked
- Exception views instead of wall-to-wall charts
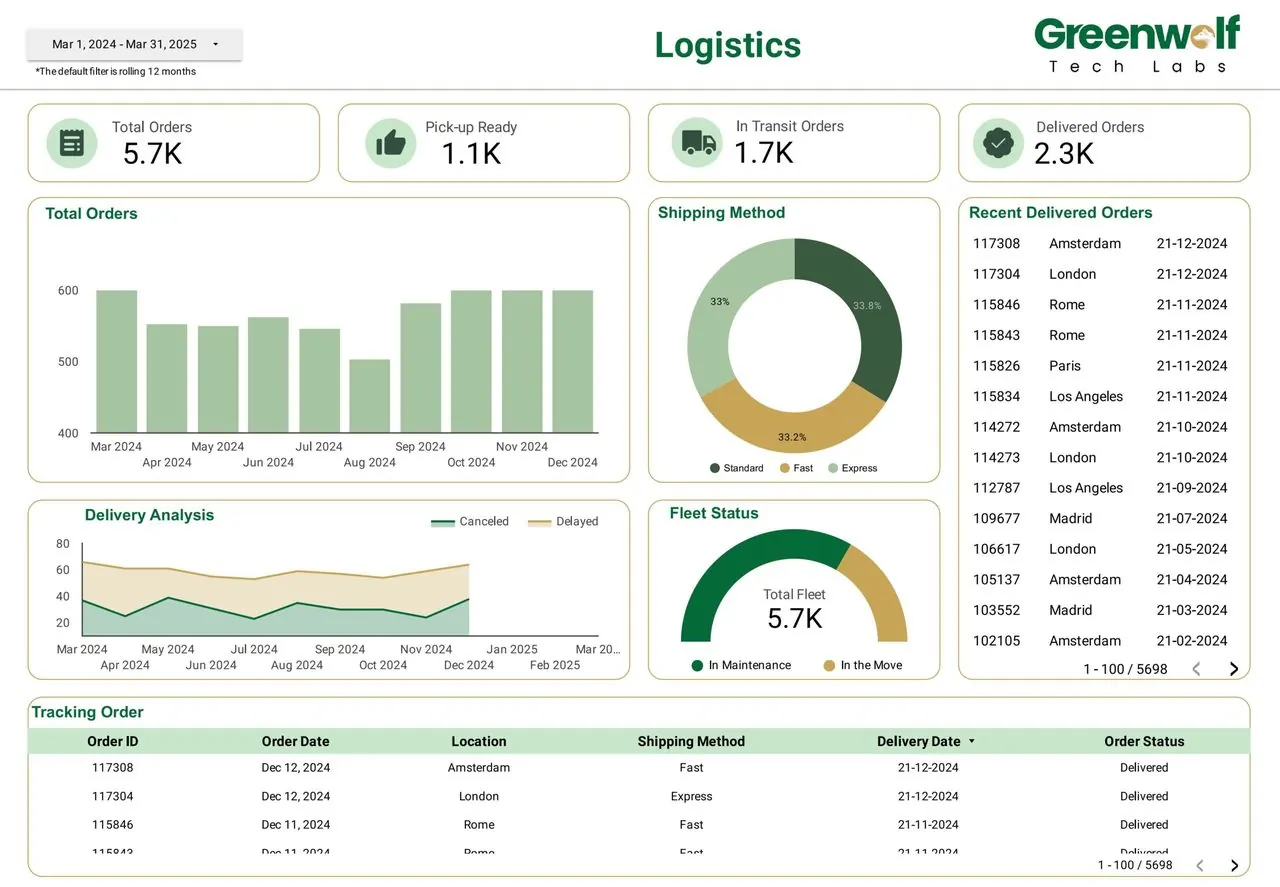
Order tracking from pickup to delivery
Every order's status in one view, joined from the order system and the carriers, so operations answers "where is it?" without opening three portals.
- Orders by stage: pickup ready, in transit, delivered
- Cancellations and delays over time
- Fleet status and shipping method mix
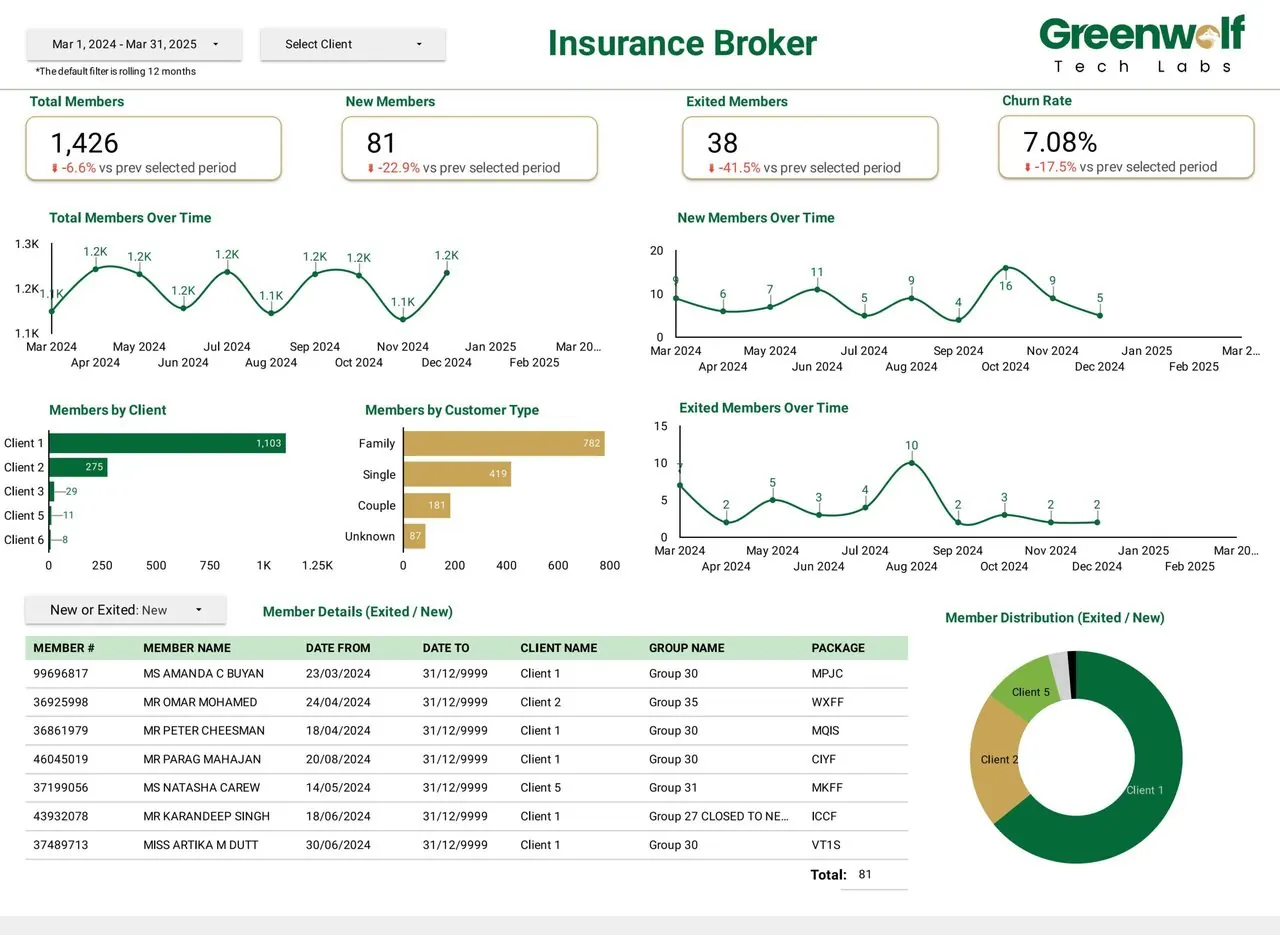
Membership and churn for an insurance broker
Members joined, lost and retained per client scheme, refreshed from the policy administration export instead of rebuilt in a spreadsheet every month.
- New and exited members against the prior period
- Churn rate by client and customer type
- A filterable member list behind every chart
04
Where your data already lives
05
Why teams choose Looker Studio over a licensed BI tool
No licence per viewer
Looker Studio itself is free. The whole company can read a report without a procurement conversation, which is usually what decides it.
Sharing that works like a document
Send a link, including to people outside your organisation who do not have a Google account. No seat to buy, no account to create.
Native to where the data already is
GA4, Google Ads, Search Console, Sheets and BigQuery connect directly, with no middleware in between to pay for or maintain.
Fast enough to keep up
A new view is an afternoon rather than a sprint, so the report changes when the business does instead of ossifying.
Where it stops, honestly
At large volumes it needs BigQuery underneath, and it is not the tool for heavy statistical modelling or complex row-level security. We will tell you when that line is close rather than after the invoice.
06
How a build runs
Decide what the dashboard is for
One call. Which decisions this has to support, who reads it, and how often. A dashboard that serves everyone serves nobody, so we agree the scope before touching data.
Model the data
Sources connected, fields mapped, definitions agreed in writing. This is where most dashboard projects quietly fail: two teams meaning different things by revenue.
Build and review
A working draft against your real data, early, so you are reacting to something concrete rather than a wireframe. Two rounds of changes are normal.
Reconcile the numbers
Every headline figure checked against the source system it came from. If the dashboard and the finance export disagree, the dashboard does not ship.
Hand it over
You own the report, the data sources and the documentation. A recorded walkthrough for the team, and the option of a support retainer if you would rather we kept it running.
07
Questions we are asked before starting
Is Looker Studio the same as Google Data Studio?
Is Looker Studio free?
What can Looker Studio connect to?
How does Looker Studio compare with Power BI or Tableau?
How long does a dashboard take to build?
Do you work with clients outside India?
Who owns the dashboard once it is built?
Can you fix a Looker Studio report somebody else built?
Tell us what the report has to answer
Send us the question your team keeps asking and where the data currently lives. We will come back with what it would take to put it on one page, and whether Looker Studio is the right tool for it.
A reply from a consultant, usually within one working day.
Part of our KPI Dashboards and BI hub. Start with our KPI dashboard development.
KPI Dashboards and BI
More on KPI dashboard development
Case Study - Automation & Dashboard
Metric Before After Time to generate reports 4-5 hours < 5 minutes Reporting accuracy 75% 99% Visibility across insurers Limited Real-time with filters Impact Overview Faster, Smarter Decision...
BI Dashboard for Sustainability & ESG Reporting
BI Dashboard for Sustainability & ESG Reporting Sustainability Reporting Needs More Than Spreadsheets As ESG disclosures become mandatory in many industries, teams can no longer rely on siloed...
BI Dashboard for Supply Chain & Supplier Performance
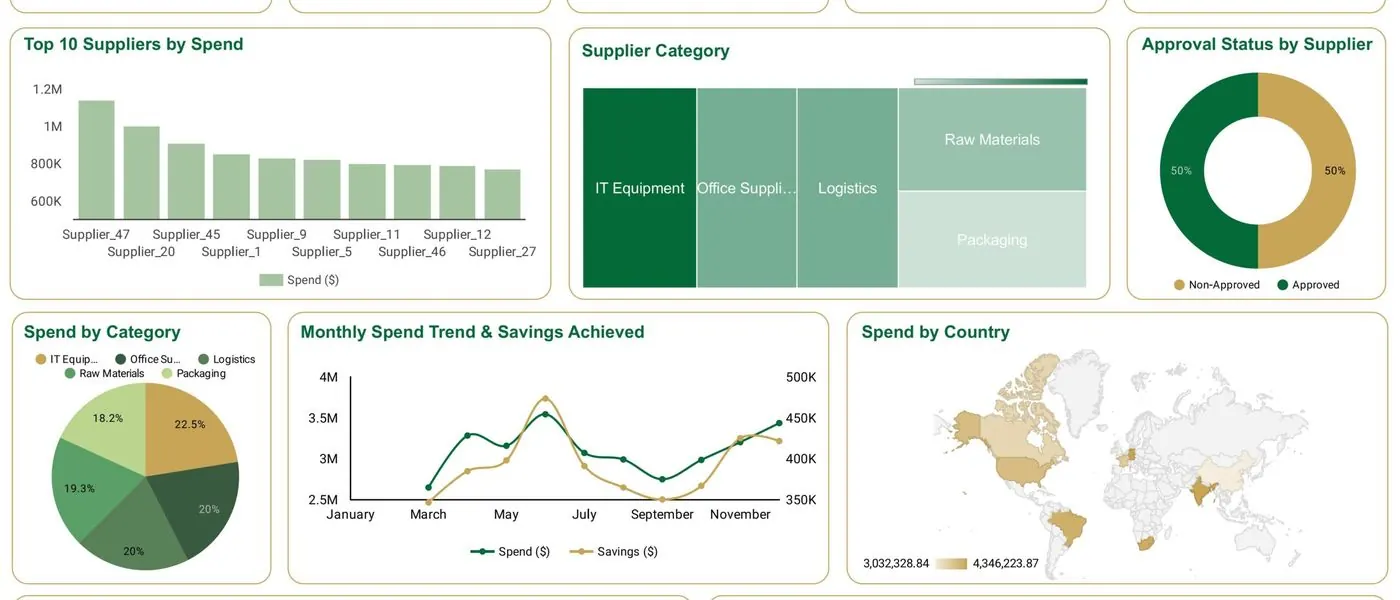
BI Dashboard for Supply Chain & Supplier Performance Procurement and Supply Chain Need More Than Spend Reports Most supply chain teams track spend, but that’s just the surface. Real...
BI Dashboard for Logistics
BI Dashboard for Pickup, In Transit, and Delivered Orders Visibility is the Backbone of Logistics When you’re managing thousands of shipments a month, status updates can’t live in...
BI Dashboard for Manufacturing Units
BI Dashboard for Manufacturing Units Why Manufacturing Teams Need Smarter Dashboards In high volume production environments, every delay, defect, and downtime minute adds up. Relying on end of...
Get started
Tell us where the week goes
Two weeks, fixed scope, a costed plan at the end. No obligation after it.
- We map your workflows and where the time actually goes
- You get the three that cost the most, with what automating them takes
- Delivered as a document, in 5 to 7 working days
Tell us where the week goes
A digital audit maps your workflows, names the three that cost the most time, and prices what it takes to automate them. No obligation after it.