

Dashboards
Business Performance Dashboard
The numbers leadership actually opens on a Monday.
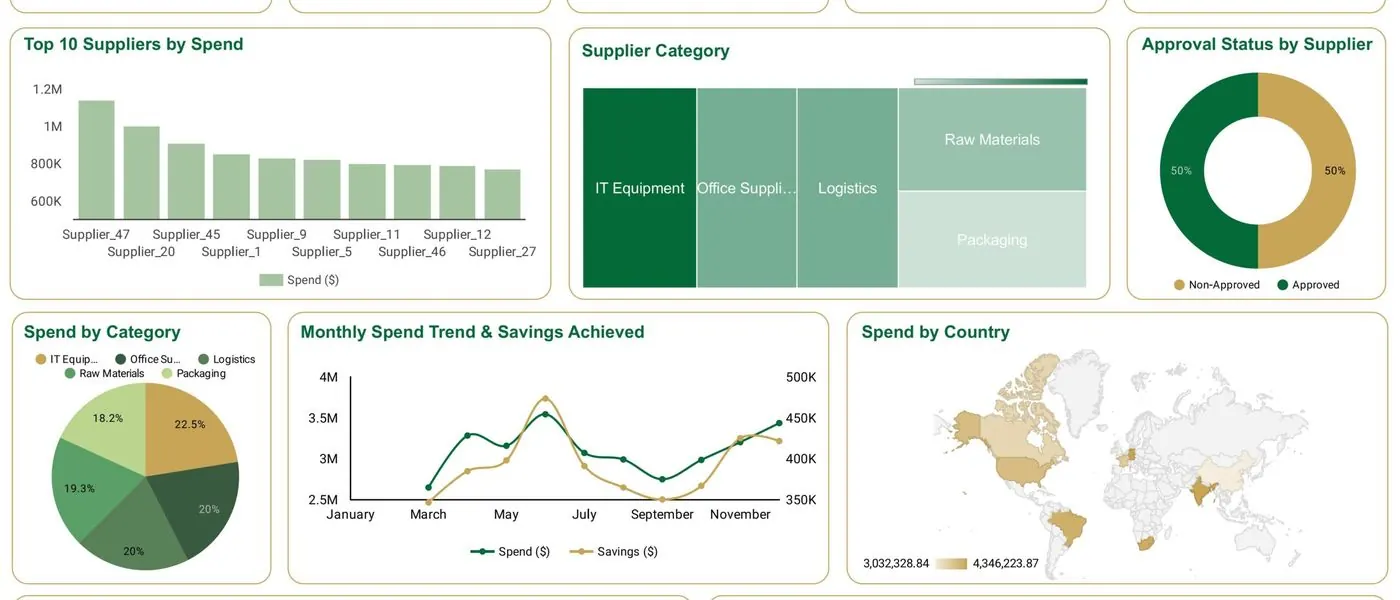
In today’s competitive business landscape, startups face numerous challenges as they strive for growth and sustainability. One crucial factor that can drive their success is having access to real-time data and actionable insights. This is where a Business Performance Dashboard for Startups comes into play. In this blog, we will explore how this service works, its benefits for businesses, the different types of...
01
How Business Performance Dashboard can Benefit Businesses
Enhanced Decision-Making
The dashboard empowers startups to make informed decisions by providing real-time, accurate data insights.
Performance Monitoring
Startups can track their KPIs, such as revenue, customer acquisition, and operational efficiency, in real-time, enabling them to identify trends and take proactive actions.
Increased Efficiency
The dashboard automates data collection and analysis processes, saving valuable time and resources.
Improved Accountability
Transparent reporting and visibility into performance metrics foster a culture of accountability within the organization.
Early Issue Identification
By continuously monitoring KPIs, startups can detect potential issues or bottlenecks early on and address them promptly.
Scalability and Growth
A performance dashboard facilitates scalability by providing startups with a holistic view of their business operations, allowing them to identify opportunities for growth and expansion.
02
How Business Performance Dashboard for Startups Works
A Business Performance Dashboard for Startups is a comprehensive data visualization tool that consolidates information from various sources into a single, easy-to-understand interface. It tracks key performance indicators (KPIs) and presents them in a visually appealing and interactive manner. By integrating with relevant data sources and employing advanced analytics , the dashboard provides startups with real-time...
03
Types of Business Performance Dashboard
Financial Dashboard
Focuses on financial metrics such as revenue, expenses, cash flow, and profitability.
Marketing Dashboard
Monitors marketing efforts, campaign performance, website traffic, and lead generation.
Customer Service Dashboard
Tracks customer satisfaction, response times, resolution rates, and feedback analysis.
Sales Dashboard
Tracks sales performance, conversion rates, pipeline analysis, and customer acquisition.
Operational Dashboard
Provides insights into operational efficiency, resource allocation, and productivity metrics.
HR Dashboard
Measures employee performance, attrition rates, training effectiveness, and workforce demographics. How Greenwolf Can Help With Business Performance Dashboard Greenwolf offers comprehensive consulting services to startups, helping them harness the power of Business Performance Dashboards. Our team of experienced consultants understands the unique challenges faced by startups and provides tailored solutions to meet...
04
Process We Follow for Business Performance Dashboard
Consultation
We begin by understanding your startup’s goals, objectives, and data requirements.
Data Analysis
Our consultants assess your existing data sources, identify gaps, and recommend necessary data integrations.
Dashboard Design
We create customized dashboards aligned with your KPIs, ensuring they are intuitive and visually appealing.
Training and Support
We provide comprehensive training to your team on using and interpreting the dashboard. Additionally, our support team is always available to address any queries or concerns.
Have a Project in Mind? Let’s Talk.
KPI Dashboards and BI
Everything we have on KPI dashboard development
Dashboards built on reconciled data: by industry, by function, and the KPIs worth putting on them.
Services
Looker Studio / Data Studio Agency
Why Your Business Needs a Looker Studio / Data Studio Dashboard How Businesses Like Yours Use Dashboards to Drive Results What Makes Our Dashboards a Growth Engine Enhanced Decision-Making Turn...
Case Study - Automation & Dashboard
Metric Before After Time to generate reports 4-5 hours < 5 minutes Reporting accuracy 75% 99% Visibility across insurers Limited Real-time with filters Impact Overview Faster, Smarter Decision...
WolfSight
Why Your Business Needs a Dashboard How Businesses Like Yours Use Our Dashboards to Drive Results What Makes Our Dashboards a Growth Engine Enhanced Decision-Making Turn fragmented data into...
Operational Dashboard Service
How Operational Dashboard Service can Benefit Businesses How Operational Dashboard Works Operational dashboards leverage advanced data visualization techniques to consolidate and present key...
Guides and articles
BI Dashboard for Pharma: Smarter Sales & HCP Insights
BI Dashboard for Pharma, Healthcare & Life Sciences Why Pharma Teams Need Better Dashboards? Data silos are a common roadblock in pharma and healthcare. Sales ops teams, brand managers, and...
BI Dashboard for Insurance Brokers & Finance Teams
BI Dashboard for Insurance Brokers & Finance Teams Insurance Brokers Need More Than Monthly Reports Static spreadsheets and delayed reports make it hard for insurance brokers to stay ahead of...
BI Dashboard for Retail Sales & Store Performance
BI Dashboard for Retail Sales & Store Performance Retail Success Requires Real Time Visibility Retail moves fast and decisions can’t wait on outdated spreadsheets or isolated POS reports....
BI Dashboard for Manufacturing Units
BI Dashboard for Manufacturing Units Why Manufacturing Teams Need Smarter Dashboards In high volume production environments, every delay, defect, and downtime minute adds up. Relying on end of...
BI Dashboard for Logistics
BI Dashboard for Pickup, In Transit, and Delivered Orders Visibility is the Backbone of Logistics When you’re managing thousands of shipments a month, status updates can’t live in...
BI Dashboard for Supply Chain & Supplier Performance
BI Dashboard for Supply Chain & Supplier Performance Procurement and Supply Chain Need More Than Spend Reports Most supply chain teams track spend, but that’s just the surface. Real...
BI Dashboard for Sustainability & ESG Reporting
BI Dashboard for Sustainability & ESG Reporting Sustainability Reporting Needs More Than Spreadsheets As ESG disclosures become mandatory in many industries, teams can no longer rely on siloed...
Get started
Tell us where the week goes
Two weeks, fixed scope, a costed plan at the end. No obligation after it.
- We map your workflows and where the time actually goes
- You get the three that cost the most, with what automating them takes
- Delivered as a document, in 5 to 7 working days
Tell us where the week goes
A digital audit maps your workflows, names the three that cost the most time, and prices what it takes to automate them. No obligation after it.