

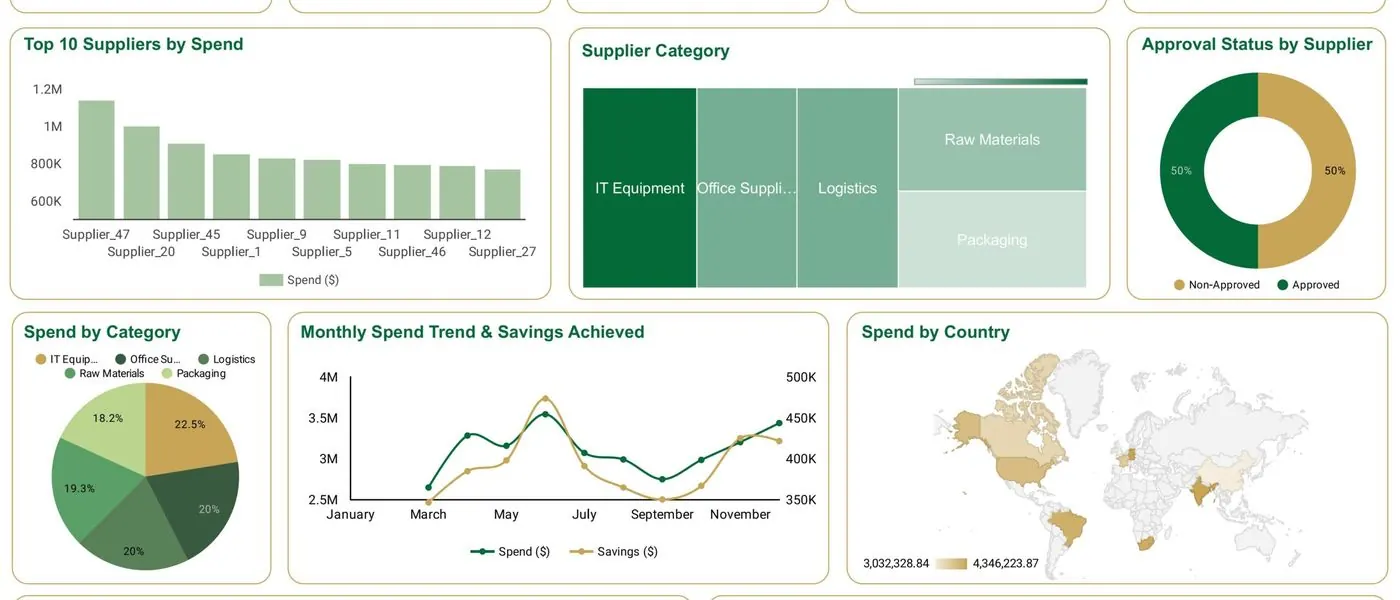
Operational Dashboard Service
How Operational Dashboard Service can Benefit Businesses How Operational Dashboard Works Operational dashboards leverage advanced data visualization techniques to consolidate and present key...
In today’s rapidly evolving business landscape, data-driven decision-making has become paramount for organizations aiming to gain a competitive edge. Operational dashboards play a crucial role in this process by providing real-time insights and visual representations of key metrics. In this blog, we will delve into how operational dashboard service work, their benefits for...
01
How Operational Dashboard Service can Benefit Businesses
Enhanced Decision-making
Operational dashboards provide real-time visibility into critical metrics, enabling organizations to make data-driven decisions promptly.
Improved Operational Efficiency
By centralizing data from various sources, operational dashboards streamline processes and identify bottlenecks, optimizing resource allocation and enhancing operational efficiency.
Early Issue Detection
Real-time monitoring of KPIs enables timely identification of anomalies, allowing businesses to address issues proactively and mitigate risks.
Performance Tracking
Operational dashboards enable continuous monitoring of key metrics, facilitating performance tracking and the identification of areas for improvement.
Increased Collaboration
With shared access to real-time data, operational dashboards foster collaboration among teams, enabling seamless communication and aligned decision-making.
Stakeholder Engagement
Interactive and visually appealing dashboards enhance stakeholder engagement by presenting complex data in an easily understandable format, facilitating effective communication and alignment.
02
How Operational Dashboard Works
Operational dashboards leverage advanced data visualization techniques to consolidate and present key performance indicators (KPIs) in a concise and intuitive manner. They aggregate data from multiple sources and transform it into actionable insights, facilitating real-time monitoring of business processes, metrics, and trends. Through customizable widgets and interactive features, operational dashboards enable...
03
Types of Operational Dashboard
Strategic Dashboards
Focused on high-level goals and long-term objectives, strategic dashboards provide an overview of the organization’s performance against key strategic initiatives.
Tactical Dashboards
Tactical dashboards provide managers and supervisors with real-time insights into operational activities, allowing them to monitor progress, identify issues, and allocate resources accordingly.
Financial Dashboards
These dashboards focus on financial metrics, providing a holistic view of an organization’s financial performance, including revenue, expenses, profitability, and cash flow.
Operational Dashboards
These dashboards focus on day-to-day operations, displaying real-time data on operational metrics such as production rates, inventory levels, and customer service performance.
Analytical Dashboards
Analytical dashboards leverage advanced analytics and data mining techniques to provide in-depth insights, enabling users to perform detailed analysis and identify trends and patterns.
HR Dashboards
HR dashboards provide key HR metrics and analytics, enabling organizations to monitor employee performance, engagement, turnover rates, and other HR-related data. How Greenwolf Can Help With Operational Dashboard Greenwolf is a trusted consulting firm that specializes in operational dashboard services. With expertise in data analytics, visualization, and dashboard design, we assist businesses in implementing and...
04
Process We Follow for Operational Dashboard
Discovery and Requirements Gathering
We conduct in-depth discussions with key stakeholders to identify the organization’s goals, KPIs, data sources, and specific dashboard requirements.
Dashboard Design and Development
Using advanced data visualization techniques, we design intuitive and visually appealing dashboards that provide actionable insights.
Data Integration and Preparation
Our experts work closely with IT teams to extract, transform, and load data from various sources, ensuring the operational dashboard receives accurate and reliable data.
Ongoing Support and Maintenance
We offer continuous support, monitoring, and maintenance to ensure the operational dashboard remains up-to-date and meets evolving business needs.
Have a Project in Mind? Let’s Talk.
Part of our KPI Dashboards and BI hub. Start with our KPI dashboard development.
KPI Dashboards and BI
More on KPI dashboard development
Looker Studio / Data Studio Agency
Why Your Business Needs a Looker Studio / Data Studio Dashboard How Businesses Like Yours Use Dashboards to Drive Results What Makes Our Dashboards a Growth Engine Enhanced Decision-Making Turn...
Case Study - Automation & Dashboard
Metric Before After Time to generate reports 4-5 hours < 5 minutes Reporting accuracy 75% 99% Visibility across insurers Limited Real-time with filters Impact Overview Faster, Smarter Decision...
BI Dashboard for Sustainability & ESG Reporting
BI Dashboard for Sustainability & ESG Reporting Sustainability Reporting Needs More Than Spreadsheets As ESG disclosures become mandatory in many industries, teams can no longer rely on siloed...
BI Dashboard for Supply Chain & Supplier Performance
BI Dashboard for Supply Chain & Supplier Performance Procurement and Supply Chain Need More Than Spend Reports Most supply chain teams track spend, but that’s just the surface. Real...
BI Dashboard for Logistics
BI Dashboard for Pickup, In Transit, and Delivered Orders Visibility is the Backbone of Logistics When you’re managing thousands of shipments a month, status updates can’t live in...
Get started
Tell us where the week goes
Two weeks, fixed scope, a costed plan at the end. No obligation after it.
- We map your workflows and where the time actually goes
- You get the three that cost the most, with what automating them takes
- Delivered as a document, in 5 to 7 working days
Tell us where the week goes
A digital audit maps your workflows, names the three that cost the most time, and prices what it takes to automate them. No obligation after it.